Contents
A few weeks ago, Axel Roest published a simple web server comparison, that turned out to not be doing what it was thought to be doing. Figuring that out was a very interesting discussion that warrants a retrospective, to look at which parts were particularly helpful and which not so much.
Tangentially, I want to highlight that Axel’s comparison is notable because he is interested in efficiency, not mere brute performance. The two are usually correlated but not always the same. He correctly noted that electricity is a major and increasingly large part of server costs (see my prior post for why it’s even worse than you likely realise). That said, while he did take RAM and power measurements, his benchmark and analysis didn’t go into detail about energy efficiency.
Benchmark method & apparatus
Axel wanted to see how a very simple web server performed in:
He was particularly interested in throughput & latency vs RAM & power usage. All are important metrics in their own right, but are most useful in light of each other.
He chose to use Fibonacci sequence calculation as the load. Choosing a load for any web server benchmark is always highly contentious, and not the focus of this post. Whether you think Fibonacci’s a good choice or not, read on to see why really it didn’t matter.
☝️ People get hung up on how well benchmarks represent the so-called real world, but I think that’s often fruitless to argue about and also beside the point. What matters is whether the benchmark is useful. e.g. does it inform and elucidate?
He did use very old hardware, though – an Intel Core i3-550 from over a decade ago. Fortunately it didn’t turn out to materially impact the relative results nor behaviours of the benchmark, but it’s usually unwise to add unnecessary [potential] variables to your setup, like unusual hardware.
In my own debugging and profiling, I used my also very old 10-core iMac Pro. It’s at least a Xeon? 😅
Benchmark results
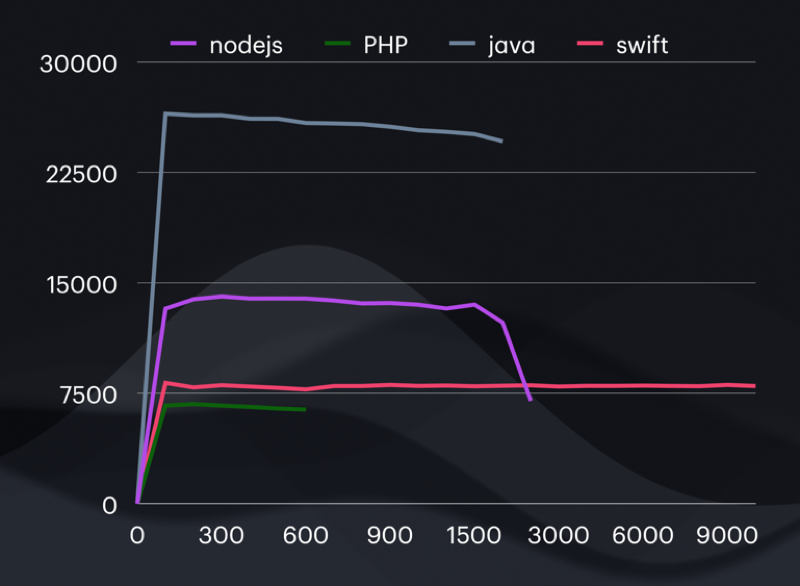
From Axel’s first post.
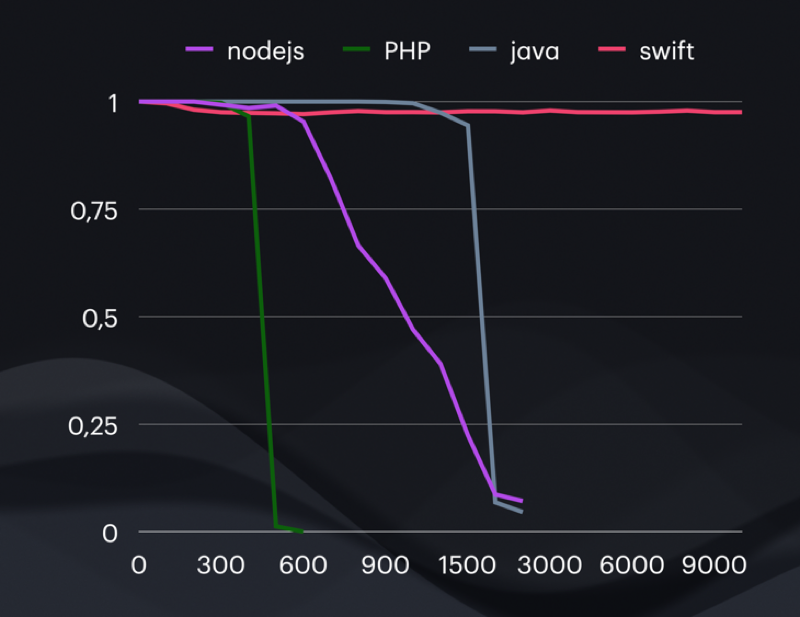
From Axel’s first post.
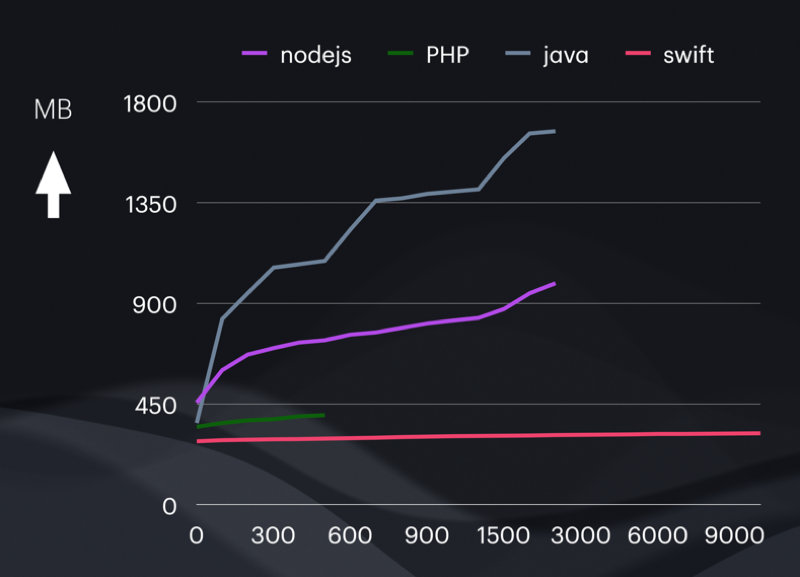
From Axel’s first post.
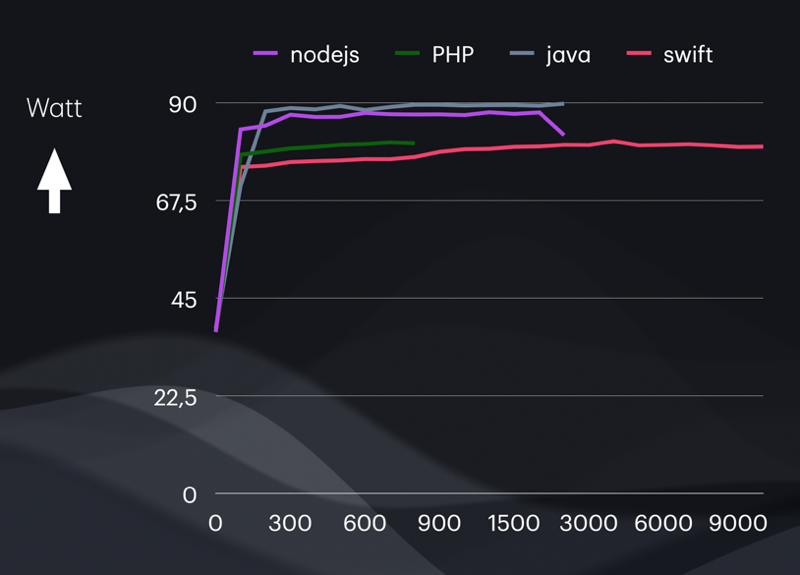
From Axel’s first post.
In words:
- Helidon (Kotlin / Java) had the highest throughput and lowest latency at low (and arguably more reasonable) loads, but used by far the most RAM, and the most power. Consequently it handled the most load before requests started failing (timing out).
- Node.js (JavaScript) was qualitatively very similar to Helidon (Kotlin / Java) but less in all metrics – less throughput, less peak load capacity, but also less RAM and very slightly less power used.
- FPM + NGINX (PHP) followed the pattern.
- Vapor (Swift) did not – it had higher throughput than PHP yet requests started failing much sooner as load increased. It used the least RAM and least power, though, and kept on trucking irrespective of the load.
Many people would have left it at that – obviously the results make sense for the first three (“everyone knows” that Kotlin / Java’s faster than JavaScript that’s faster than PHP) and Vapor / Swift apparently just isn’t fast and has weird reliability behaviours. QED, right?
⚠️ Going in with a specific hypothesis can be helpful, but hypotheses can also end up being just biases. Be careful not to blindly accept apparent confirmation of the hypothesis. Similarly, beware subconscious hypotheses like “Kotlin / Java is faster than JavaScript”.
To his credit, Axel wasn’t so sure – he felt that the results he was seeing were suspicious, and he sought help from the Swift Forums in explaining or correcting them.
✅ Question your results. Understand them. It improves the quality, correctness, and usefulness of your work. Why something behaves the way it does is often more interesting and important than merely how it behaves.
On most platforms it’s pretty easy to at least do a time profile, and most often that’s all you need to understand what’s going on. On Apple platforms you can use Instruments, on Windows & Linux tools like VTune, among many other options.
If need be, ask others for help, like Axel did.
While Axel did suspect something was wrong – noting the oddly small but persistent failure rate – he missed the most obvious proof of wrongness – logically impossible results. Doing 80,000 continuous concurrent streams of requests with ~98% of those requests completing within the two second time limit means the server must have a throughput of at least 39,000 requests per second. Yet the benchmark tool reported a mere ~8,000 requests per second.
Sadly, though I pointed this out as the very first response to the thread, it seemed to be overlooked by everyone (even myself!), even though it clearly fingered the benchmark tool itself as the problem (which is only partially correct, as we’ll see later, but in any case was the exact right place to start looking).
Debugging the benchmark
Domain experts weigh in
The Swift Forum post immediately attracted relevant people: folks that work on Vapor and NIO, and folks that have experience using them. However, ironically this didn’t initially help – they tended to assume the problem was in Vapor (or its networking library, SwiftNIO) or how Vapor was being configured. It turned out none of this was really true – there was a small optimisation made to Vapor as a result of all this, which did marginally improve performance (in specific circumstances), but ultimately Vapor & NIO were not the problem, nor was the benchmark’s configuration and use of them.
⚠️ It can be all too easy to assume elaborate reasons when you know a lot about something. Don’t jump to conclusions. Check the most basic and foundational things first.
I say this with humility and I guess technically hypocrisy, because even as professional performance engineer (in the past) I’ve repeatedly made this mistake myself. We’re all particularly susceptible to this mistake.
There were some assertions that the results were plausible and just how Vapor performs, and that the “problem” was the choice of Vapor rather than some other web server framework (e.g. Hummingbird).
⚠️ It’s not wrong to be interested in additional data, but be careful not to get distracted. Using Vapor was not in any way wrong or unhelpful – it is the most well-known and probably well-used web server framework in Swift. It might well be that other frameworks are better in some respects, but that’s a different comparison than what Axel performed.
Others similarly asserted that the results were plausible because Swift uses reference-counting for memory management whereas PHP, JavaScript, and Kotlin / Java use garbage collection. It was presented as “common knowledge” that garbage collection has inherent benefits for some programs, like web servers, because it makes memory allocation super cheap.
⚠️ While it can be useful to speculate a little, in a brainstorming sense, don’t presume. A lot of mistakes have been made over the years because of this, like that “linked lists are faster than arrays” or “binary search is faster than linear search”, etc.
Remember that intuition is in large part presumptions and generalisations. That doesn’t make intuition useless, but always remember that it’s far from foolproof. Use it to generate hypotheses, not conclusions.
Examining the load
Even though it was clear that something was wrong with the actual measurements, a lot of the early discussion revolved around the load used (Fibonacci sequence calculation), particularly regarding whether it was:
The “right” load
A few folks asserted that the CPU-heavy nature of calculating Fibonacci numbers isn’t representative of web servers generally. Multiple people noted that – in the Swift implementation, at least – the majority of the CPU time was spent doing the Fibonacci calculation. Some felt this was therefore not a useful benchmark of Vapor itself.
A lot of this boiled down to the “no true Scotsman” problem, which is very common in benchmarking, with a bit of perfect world logical fallacy peppered in, trying to identify the One True Representative Benchmark. See the earlier point about fixating on such matters rather than whether the benchmark is useful.
⚠️ While it’s not necessarily wrong or unwise to evaluate how well a benchmark represents real world usage (whether generally or against specific cases), it’s an exercise that suffers from diminishing returns pretty quickly. It’s usually best to not quibble too much or too long, as long as the benchmark is in the ballpark.
You can always develop & present your own benchmark(s), if you feel there are better or additional ways to go about it. Best of all, the existence of both the original benchmark and your benchmark(s) will be more useful than either alone, since you can compare and contrast them.
A “fair” load
Accusations were made pretty quickly that the benchmark is “unfair” to Swift because Swift doesn’t – it was asserted – have a properly-optimised “BigInt” implementation, unlike all the other languages tested.
No real evidence was given for this. Even if it were true, it doesn’t invalidate the benchmark – in fact, it just makes the benchmark more successful because it’s then highlighted an area where Swift is lacking.
The BigInt library that Axel used, attaswift/BigInt, is by far the most popular available for Swift, as judged by things like GitHub stars, forks, & contributor counts, ranking in web & GitHub searches, etc. There are quite a few others, though.
☝️ There are multiple ways to approach a benchmark, all equally valid because they’re all useful. Axel chose to use popular packages, in all the languages he tested. That’s definitely fair. It’s also useful because it represents what the typical developer will do when building real web servers.
It’s often also interesting and useful to search out the best packages (whatever that may mean in context, such as fastest). That could represent what a more heavily optimised implementation might do. It might also better represent what is theoretical possible (if optimal packages exist already). Those are interesting things to explore too, just not what Axel happened to be doing.
You can see also more of my thoughts on Axel’s choice here, in the Swift Forums thread.
It wasn’t until actual evidence was presented, that the discussion made progress.
⚠️ While it’s true that without the initial blind assertions actual data might never have been gathered, it would have been more effective and efficient to have just gathered the data at the start.
Data is better than supposition.
It was shown that in fact the BigInt implementation in question was significantly slower than it could be, because JavaScript’s implementation of addition was much faster. Some additional simple tests showed even wider performance gaps regarding the other key operation: rendering to strings. It was that data that turned out to be critical – I myself happened to have implemented BigInt string rendering for Apple’s new Foundation, and then saw it dramatically optimised by Oscar Byström Ericsson, whom has his own BigInt package for Swift, Numberick. So I had a pretty darn good idea of where I might find a faster package… 😆
You can read more about that specific bit of serendipity in the Swift Forums thread.
It was trivial to do the package switch, and it quickly improved Vapor/Swift’s showing in the benchmark manyfold – in combination with some other simple and reasonable tweaks, it was five times faster!
✅ Axel’s benchmark taught a lot of people that Numberick is much more performant than BigInt, at least in some important operations (addition and string rendering). Granted that knowledge is a little bit niche in its utility, but it’s still a good outcome.
It also demonstrated that modifying in place can be faster than creating a copy, even if it means having to do a swap. i.e.:
a += b
swap(&a, &b)
…instead of:
let c = a + b
a = b
b = c
That’s a tidbit I had picked up through varied experiences, and wrote about previously. The swap function in Swift is under-appreciated and under-utilised. This knowledge may seem esoteric but you’d be amazed how often it applies (a lot of programming is about combining data, after all).
Axel posted a follow-up with additional data (with the aforementioned changes and optimisations). That showed Swift now beating out the other three frameworks / languages, with the highest throughput and lowest latency (and still the lowest RAM and power usage).

So, all done, right? Turns out, Vapor/Swift wins, yeah?
Well, maybe.
Do these improvements apply to the other cases too?
That is yet to be examined. Because only Swift seemed to be producing odd results, Axel only put the benchmark to the Swift community for deeper analysis. It’s quite possible that doing the same with the other web frameworks & languages would similarly reveal potential improvements.
Still, the results are useful as they stand. Some simple and very plausible – even for a Swift beginner – optimisations made a big difference, though of course the biggest difference was simply using a different 3rd party package. There are a lot of useful lessons in that, both in the specifics as already covered and as general best practices.
☝️ Benchmarks are rarely “done”, their results rarely “final”. At least if you permit optimisations or other changes. How do you know there’s not something still “unfair” about one of the cases?
Again, this speaks to the potential futility of trying to make “fair” benchmarks, and reiterates the practical benefit of simply trying to learn instead.
…but… why is the success rate still weird?
Despite the improved performance, a fundamental problem remained: the numbers still didn’t make sense.

The success rates are slightly different but not materially – as concurrent requests go up, the throughput plateaus very quickly, yet success rate remains about the same. It’s exactly the same problem as at the outset – these results cannot possibly be correct.
Despite all the community’s efforts, we hadn’t actually figured out the real problem. We’d merely made Swift look better, without actually providing confidence in the accuracy of the results.
In fairness to myself, I was well aware that we weren’t done, I was just struggling to understand what was really going on, as I noted here.
Examining the benchmark tool
While there’d been some tangential questions about wrk, the benchmarking tool Axel used, it had largely been ignored thus far.
Ironically (as you’ll soon see) Axel chose wrk specifically because he didn’t like the behaviour he saw with ApacheBench. Mostly its lack of HTTP/1.1 connection reuse (a subjective but valid methodology choice on Axel’s part) but also because it sounds like he saw some inexplicable results from it too. In hindsight, that might have been a clue that something more pervasive was wrong.
In retrospect there were a few tangential comments in the Swift Forums thread that were on the right track, e.g.:
…when a new connection comes in, the server needs to make a decision: It can
Johannes Weiss, Swift Forums post
- Either accept the new connection immediately, slowing the existing connections down a little (because now there are more connections to service with the same resources as before)
- Or it can prioritise the existing connections and slow the connection acceptance (increasing the latency of the first request in the new connection which now has to wait).
As a little spoiler, it seems apparent that the other three web frameworks all accept incoming connections virtually immediately with priority over any existing connections & request handling (even though they don’t necessarily attempt to serve all those connections’ requests simultaneously). Vapor does not.
Suspicions did [correctly] develop around the opening of the connections themselves, which triggered testing with longer timeouts in a somewhat blind attempt to cover-up the “spurious” first moments of the test.
❌ Trying to essentially just hide inconvenient results is unlikely to help. It may even be successful, which is the worst possible outcome because it’s basically just burying a time-bomb into the benchmark, and forgoing any real understanding & potential knowledge to be gained from properly investigating the problem.
Characterising the failure mode(s)
Though admittedly I wasn’t fully conscious of what I was doing at the time, the next breakthrough came from simply gathering more data and analysing it qualitatively. This helped in two key ways:
- It better defined and pinned down the circumstances in which things appear to go wrong with the benchmark itself.
It separated out a whole bunch of test configurations that seemingly weren’t interesting (as they behaved in line with intuition / expectations, and similarly across all four web servers).
✅ When it doubt, try to better define the problem. Eliminate variables. Refine quantitative estimates. Make your life easier by eliminating things that don’t matter.
- It provided hints and potential insight into the nature of the problem.
It showed that there was some kind of variability (in time) in the benchmark’s behaviour, with three very distinct modes (including one which was basically the benchmark actually working as expected, the existence of which had been unknown until that point!).
✅ There are many ways to approach a data set, in terms of analysis methods. It’s a good idea to always keep that in mind, and to try different analysis mindsets whenever you seem stuck (and also to further validate conclusions).
Interestingly although ultimately only tangentially, this modality finding prompted quite a few “me too!” responses from other folks, about a variety of use-cases involving Vapor or NIO. I took that as affirmation that I was onto something real, but in retrospect that should have been an even better clue: the fact that some people had seen this issue without Vapor involved – the only common denominator was NIO. Even though it turns out NIO itself wasn’t doing any wrong, it was on the right path to answers. This was specifically pointed out to everyone, even.
☝️ Sometimes, it just comes down to needing to listen better.
Overlooked clues
At this point there were a bunch of discussions about benchmark tool configuration, hardware arrangement, whether TLS should be used, etc. I’m going to skim over it, because there’s not much to ultimately say about it – it turned out to not be on the right track in this case, or purely tangential, but it was entirely reasonable to investigate & discuss those aspects. Such is debug life.

What’s interesting is that yet another key clue was mentioned in the Swift Forums thread, yet was overlooked because it was attributed incorrectly and the mechanics miscategorised:
Don’t test with more than 128 connections. You will get read errors. This is due to the file descriptor limit applied to each process on macOS. As @johannesweiss mentioned earlier the default for this is 256. You can change this but it involves disabling the System Integrity Protection.
Adam Fowler, Swift Forums thread
The 128 connections & read errors parts were spot on, in hindsight. But the rest was incorrect (it’s not about the file descriptor ulimit) and in particular the incorrect statement about having to disable SIP perhaps further distracted readers (corrections were posted in reply, which perhaps steered the thread away from what actually mattered).
I’m not sure what precisely the lesson is here… if Adam had better understood the behaviour he’d seen previously (re. 128 connections being the apparent limit) he might have been able to immediately point out one of the key problems. But who can say why he didn’t quite understand that limit correctly, or whether he should have. This sort of thing happens, and maybe it suggests a failure to properly diagnose problems previously, but mostly I’d just point out that the discrepancy here – between 128 and 256 – should have been noticed, and had it been questioned it would have accelerated progress towards the root cause.
Speaking just for myself, I think I (erroneously) dismissed Adam’s comment because I already knew that the default file descriptor limit is not actually 256 (it’s 2,560 on macOS, mostly) and so I assumed the whole comment was wrong and irrelevant.
⚠️ Partly wrong is not the same as completely wrong (let-alone useless).
Another clue was put forth, yet again essentially by accident (without understanding its significance, at the time):
Yes, the reason I used
wrk, is that it uses pipelining. That’s why ab (apachebench) had such terrible performance: it opened a new socket for each request. And then it overloaded the system by throwing
socket: Too many open filesapr_socket_recv: Connection reset by peererrors.
I raised the
Axel Roest, Swift Forums threadulimit -nto 10240, but stillapr_socket_recv: Connection reset by peer (104)occurred occasionally.
This hinted very directly at the second major problem, but it seems nobody in the forum thread realised it. I think there was still a pre-occupation with the file descriptor ulimit.
A little logic applied at the time of Axel’s comment should have revealed its mistaken presumption: that opening new TCP connections for each HTTP request will inevitably cause connection failures. Sure, it will if you give it enough concurrent connection attempts, but real-world web servers operate at huge loads that are basically one HTTP request per connection, without any significant reliability problems. In hindsight, it’s clear that Axel’s dismissal of this behaviour as in any way normal was a mistake – as was everyone else in the thread going along with that dismissal.
⚠️ If a tool isn’t working the way you expect, maybe that’s telling you something important. Just switching tools until you find one which doesn’t exhibit the problem doesn’t necessarily mean it’s not still a problem.
A misunderstood workaround
In parallel to all of the above discussion in the Swift Forums thread, I’d been diving into wrk to see what it was really doing. I discovered a way to eliminate the errors: by opening all the TCP connections in advance in a way that happened to limit how many were attempted concurrently by wrk thread count which happened to be low enough in my use of wrk to not hit the magic 128 limit (more on that later). As you can see in my forum post on this, I initially misunderstood how wrk functioned and misattributed the root cause as bugs / bad design in wrk.
In my defence, wrk isn’t written very well, eschewing such outrageous and bourgeois software engineering practices as, you know, actually checking for errors. So it wasn’t unreasonable to believe it was ultimately just broken, given plenty of evidence that it was at least partly broken (which it was & is), but it was ultimately a mistake to let that cloud my judgement of each individual behaviour.
Then again, if I hadn’t been so appalled by the bad code in wrk, and taken it upon myself to rewrite key parts of it, I might not have stumbled onto the above “fix” and therefore also not found the true cause, later.
✅ Improving error handling & reporting is practically always a good idea. And when debugging a problem it can be helpful even if it doesn’t feel guided – the whole point of absent or incorrect error reporting is that you don’t know what you’re missing, so you may well reveal an important clue “by accident”.
It’s never the compiler or the kernel… except when it is
At the time I did think I’d actually fixed wrk; I didn’t realise I’d merely found an imperfect workaround. I’d solved the connection errors (not really)! But, I was still curious about one thing – something pretty much everyone had kinda ignored this whole time:
Though those lingering few read/write errors still bother me. I might look into them later.
Me, Swift Forums thread
✅ Curiosity is powerful. Why did my chocolate bar melt in my pocket when I walked through the lab, maybe that’s interesting? Why did this contaminated Petri dish end up full of fungus instead of bacteria, maybe that’s interesting? Why’s this unused screen glowing, maybe that’s interesting? Ow, why did this apple fall on my head… but, maybe that’s interesting? (apocryphal, but close enough)
Tracing those reported errors to their cause was quite a challenge. The only known way to reproduce the errors was to use a very high number of concurrent TCP connections (several thousand), which made it hard to follow any single connection through its lifecycle using any low-brow methods (printf debugging etc). I eventually managed using System Trace2 (lamenting, the entire time I used Instruments, that it would have been so much easier in Shark).
Unfortunately, what I was seeing – while in fact correct – did not make sense to me, so I was hesitant to take it on face value.
The lack of any error reporting on the server side, because Vapor lacks it completely, was also both a known problem at the time and also a problem in hindsight. Had Vapor/NIO actually reported the errors they were encountering, it would have partially validated what I was seeing in the system traces – in fact, it would probably have saved me from having to capture & analyse system traces.
❌ Ignoring errors is always a bad idea. I mean, duh, right? But apparently it has to be reiterated.
Alas I don’t actually remember now precisely what led me to the final answers and root causes. I know it involved many hours of experimenting, exploring hypotheses, and in generally fiddling with everything I could think of.
Somehow or other, I did finally cotton on to a key configuration parameter: kern.ipc.somaxconn.
That controls how many connection requests can be pending (not formally accepted by the server) at one time. It defaults to 128 on macOS. Remember that number, 128?
Once I had figured out that kern.ipc.somaxconn directly controlled the problematic behaviour, the rest followed pretty naturally and quickly – I realised that what I saw in the system traces was in fact accurate, and that in turn revealed that the macOS kernel contains multiple surprisingly blatant and serious bugs (or at the very least dubious design choices, and lying documentation) regarding TCP sockets in non-blocking mode. I wrote that up in some detail in the second half of this Swift Forums post.
As a sidenote, that darn magic number that everyone kept ignoring – 128 – cropped up yet again, in the listen man page, though by the time I saw it there it was merely a confirmation of what I’d already discovered, than a helpful clue. Still, perhaps there’s a lesson there: read the man page. 😆
❌ When documenting known bugs and limitations, explain them fully. Don’t just say e.g. “more than 128 doesn’t work”, say why.
Conclusion
All told, the major problems identified by the benchmark were (and not all of these were mentioned above, but you can find all the details in the Swift Forums thread):
- The particular 3rd party library used for BigInt support in Swift, attaswift/BigInt, performs quite poorly.
- Vapor would accept too few connections per cycle of its event loop (promptly fixed, in 4.96.0).
- The benchmark tool used,
wrk, has numerous bugs:- It doesn’t always use the configured number of concurrent connections.
- It doesn’t measure latency correctly.
- It doesn’t report errors correctly (in the sense both that it miscategorises them, e.g. connect vs read/write, and that it doesn’t provide enough detail to understand what they are, such as by including the errno).
- The macOS kernel (and seemingly Linux kernel likewise) has multiple bugs:
- Connection errors are reported incorrectly (as
ECONNRESETorEBADF, instead ofECONNREFUSED). - kqueue (kevents) behaves as if all connections are always accepted, even when they are not. Put another way, you cannot actually tell if a connection was successful when using non-blocking sockets on macOS.
- Connection errors are reported incorrectly (as
- Key network configuration on macOS & Linux is way too restrictive:
- Maximum file descriptors per process is only 2,560 generally on macOS, and even less (256) in GUI apps. It may vary on Linux, but on Axel’s particular server it was 1,024.
- Maximum number of unaccepted connection requests (the
kern.ipc.somaxconnsysctl on macOS,/proc/sys/net/core/somaxconnon Linux) is only 128 on macOS. It may vary on Linux.
It appears that the kernel bugs apply to Linux as well (although it’s not known if kqueue was in use there, as wrk also supports epoll and select), as the behaviour seems to be the same between macOS and Linux.
With the above issues fixed or worked around, his benchmark produces more explicable results (but keep in mind that the difference in connection acceptance behaviour is real and reflects a different design trade-off in Vapor, which may be a problem for real-world use if you don’t raise somaxconn and the listen backlog limit enough).
And that’s all just the problems Axel’s benchmark surfaced – there was a whole host of other interesting lessons taken away from all this (only a fraction of which were highlighted in this post – many more can be found in Axel’s posts and the Swift Forums thread).
Nominally the end result is also a benchmark that shows Vapor (Swift) out-performing other popular web frameworks in other languages. Hugely out-performing them, if you factor in not just throughput & latency but RAM & power usage. But, to reiterate what I pointed out earlier, take that with a grain of salt.
So, for a benchmark that many initially decried as unrealistic or plain poorly conceived, it turned out to be pretty darn useful, I think. And if that doesn’t make it a successful benchmark, I don’t know what does.
Addendum: post title
Looking at the comments about this post on HackerNews etc, I feel like I have to explain the title a little. I was quite pleased with myself when I came up with it (admittedly by accident), because it’s subtle and I think kinda clever, but perhaps too subtle.
“Swift sucks at web serving… or does it?” is a [platonic] double entendre.
On face value it’s alluding to the more typical type of post that is both (a) click-baity and (b) a standard “turns out” story where actually Swift is awesome at web server and haha to all those who doubted it. (where one can replace the word “Swift” with basically any programming technology, because benchmarking brings out some ugly competitiveness from the community)
But really what it means here, if you read the whole post, is that actually we still don’t know. It’s alluding to the oft-overlooked fact that benchmarks are rarely as conclusive as they’re presented. Which I thought was quite clever because it reiterates, at a meta level, my whole point about learning being more important than competing.
At least, that was the idea. 😆
- Helidon itself is written in Java, but Axel used Kotlin for his little web server implementation – including most crucially the Fibonacci calculations. Both interoperate atop the JVM and plenty of “Java” libraries are partly written in Kotlin, or have dependencies written in Kotlin – and vice versa. A little like Objective-C and Swift interoperate such that many Mac / iDevice apps use a rich mix of both and you don’t typically need to care which language is used for any particular piece. ↩︎
- I always endeavour to link to the things I mention, but in this case there’s nothing to link to – Apple don’t provide any actual documentation of the System Trace tool in Instruments, and there’s not even any usable 3rd party guide to it, that I can find. It’s a sad demonstration of Apple’s general indifference to performance tools. 😔
Apple don’t even have a proper product page for Instruments itself – the closest you can find is merely its Help. ↩︎


@everything Wow what a story!
Remote Reply
Original Comment URL
Your Profile
Why do I need to enter my profile?
This site is part of the ⁂ open social web, a network of interconnected social platforms (like Mastodon, Pixelfed, Friendica, and others). Unlike centralized social media, your account lives on a platform of your choice, and you can interact with people across different platforms.
By entering your profile, we can send you to your account where you can complete this action.
@everything Nice write-up of this epic thread!
It would be nice to see the complete updated results somewhere for reference, especially since you’ve got the outdated ones so prominently in the introduction.
Could make for a nice side by side showing the difference!
Remote Reply
Original Comment URL
Your Profile
Why do I need to enter my profile?
This site is part of the ⁂ open social web, a network of interconnected social platforms (like Mastodon, Pixelfed, Friendica, and others). Unlike centralized social media, your account lives on a platform of your choice, and you can interact with people across different platforms.
By entering your profile, we can send you to your account where you can complete this action.
@finestructure @everything Yep, Axel hasn’t yet done a [hopefully] final re-run to get fully corrected results. Though I don’t expect they’ll change much from his second post (it should just fix the success rate). I believe he’s intending to do a third post, for those revised results. I’ll update mine to link to it, when he does.
Remote Reply
Original Comment URL
Your Profile
Why do I need to enter my profile?
This site is part of the ⁂ open social web, a network of interconnected social platforms (like Mastodon, Pixelfed, Friendica, and others). Unlike centralized social media, your account lives on a platform of your choice, and you can interact with people across different platforms.
By entering your profile, we can send you to your account where you can complete this action.
Alex wanted to see how a very simple web server performed in:
Name typo in first section
Gah! I kept making that mistake when I was writing this, but I thought I’d corrected all of them. Obviously not. Thanks for pointing this out, and sorry Axel!
By definition of TCP behavior, any time that there is no service listening on a port, the OS issues a TCP RST packet back to the client. This is the way connection refused works. There are, of course other reasons that RST is sent, but the ECONNRESET return instead of ECONNREFUSED is something that should be expected.
Maybe. But that’s not what the documentation suggests (the
listenman page):Granted it does say “may” which is ambiguous, but it’s clear right from the name that
ECONNREFUSEDis the intended and appropriate errno for that situation.EBADF, which is what is actually signalled in that situation currently, is completely wrong.The
somaxconnlimit results in theECONNRESET. I’m not sure why it manifests as a different code for what is surely the exact same pattern on the wire – presumably that RST packet signalling connection denial – but it also shows that somehow the recipient kernel can distinguish between those two cases. It also knows what state the connection is in – i.e. the difference between connecting and connected – which should be enough to map to the appropriate error code, too.(Possibly there’s some race conditions in transmission retry situations, which might make it technically impossible to always deduce the correct errno to signal. But that’s a rare edge case which doesn’t excuse the general case behaviour.)
@everything I followed this in the Swift forum thread. What was striking is how collaborative and professional it was.
Maybe my experience in corporate life has made me jaded. It feels like this could have been a circular firing squad of blame and recriminations. Instead it was just curious people trying to be helpful.
That spirit in a community is a delightful positive force.
Remote Reply
Original Comment URL
Your Profile
Why do I need to enter my profile?
This site is part of the ⁂ open social web, a network of interconnected social platforms (like Mastodon, Pixelfed, Friendica, and others). Unlike centralized social media, your account lives on a platform of your choice, and you can interact with people across different platforms.
By entering your profile, we can send you to your account where you can complete this action.
@pixelscience @everything Yeah, it was partly because it was such an interesting conversation and collaboration that I wanted to write about it. That and that it had a happy ending (there’s plenty of similar “why is this code weird?” threads which alas never find closure).
There’s fairly often some great threads in the Swift Forums, like that. Not always, of course, but I suppose that’s unavoidable with a public common.
Remote Reply
Original Comment URL
Your Profile
Why do I need to enter my profile?
This site is part of the ⁂ open social web, a network of interconnected social platforms (like Mastodon, Pixelfed, Friendica, and others). Unlike centralized social media, your account lives on a platform of your choice, and you can interact with people across different platforms.
By entering your profile, we can send you to your account where you can complete this action.
Awesome post and investigation! Couldn’t leave without commenting. On top of the specific issue being discussed, the conclusions and take aways after every step are spot on, applicable to different debugging scenarios, and worth remembering. Wish everyone approached problems with this mindset. Thanks for taking the time to write everything up!
I can’t find meaningful results yet.
Even the 3rd version of the post doesn’t make any sense..
1) There is no way to process 8k concurrent connections without **any** growth in memory – still something wrong. I don’t know where – in wrk, in script that reading memory usage.. somewhere
2) How Vapor could be close to the RPS and Latency of Helidon?
If the code (provided by the Core Vapor developer) here is wrong, and Vapor could do much better – please make a PR:
https://web-frameworks-benchmark.netlify.app/result?asc=0&f=vapor-framework,helidon-se&metric=totalRequestsPerS&order_by=level512
In TechEmpower Vapor is even not the best in Swift… and even Java solutions are just way superior over there (not even mentioning Go and Rust)
https://www.techempower.com/benchmarks/#hw=ph&test=plaintext§ion=data-r22&l=v2qiv3-cn3
3) In the 3d post again we can see ~97% of succeeds for 8k concurrent connections? with <50Mb or RAM with calculating Fib numbers?
If it will be true – most of the high-load services already were on the way to rewrite their code base to Vapor :)
Which is obviously again – non realistic
4) Moreover even to send 8k concurrent connections requires a lot of CPU/RAM. If everything is running on single machine – wrk and server should start fighting for resources..
Consider to use 2 server configuration. One with benchmark tool and another with the server (connected by LAN).
5) There are plenty of options that could be used instead of "original" wrk.
Rewrk, bombardier and many others (https://github.com/denji/awesome-http-benchmark)
Oh after another look at the memory graph – I just think the whole graph is wrong. Slight changes only for Node.js (probably just some std in the measurements). Having no difference in memory to handle 32 concurrent connections and 9k has no sense for any language and framework.
It seems my first comment was not posted :)
Let me try one more time.
I think even 3rd version of the post has no sense..
Shortly speaking, there is no way to process 8k concurrent connections with <50 Mb and with 95% success rate (something wrong. Maybe graphs were not updated properly?)
If you check popular projects like TechEmpower and the-benchmarker/web-framework in the GitHub – Vapor is not the best even in Swift category, and not comparable to Java frameworks (in terms of RPS and Latency). Not mentioning Go and Rust solutions
And as I assume Memory analysis is just showing wrong numbers.. for all languages.
Run 8k concurrent connections is heavy operation for CPU. And wrk and the server could start fight for resources. So also consider to use 2 machines for testing: one with benchmark tool and another one with the server
And I think there is no reason to use exactly wrk.. Rewrk, bombardier, goose, oha and many others.