By which I mean, things like ContinuousClock and SuspendingClock.
In absolute terms they don’t have much overhead – think sub-microsecond for most uses. Which makes them perfectly acceptable when they’re used sporadically (e.g. only a few times per second).
However, if you need to deal with time and timing more frequently, their inefficiency can become a serious bottleneck.
I stumbled into this because of a fairly common and otherwise uninteresting pattern – throttling UI updates on an I/O operation’s progress. This might look something like:
struct Example: View {
    let bytes: AsyncSequence<UInt8>

    @State var byteCount = 0

    var body: some View {
        Text("Bytes so far: \(byteCount.formatted(.byteCount(style: .binary)))")
            .task {
                var unpostedByteCount = 0
                let clock = ContinuousClock()
                var lastUpdate = clock.now

                for try await byte in bytes {
                    … // Do something with the byte.

                    unpostedByteCount += 1

                    let now = clock.now
                    let delta = now - lastUpdate

                    if (    delta > .seconds(1)
                         || (    (delta > .milliseconds(100)
                              && 1_000_000 <= unpostedByteCount))) {
                        byteCount += unpostedByteCount
                        unpostedByteCount = 0
                        lastUpdate = now
                    }
                }
            }
    }
}
☝️ This isn’t a complete implementation, as it won’t update the byte count if the download stalls (since the lack of incoming bytes will mean no iteration on the loop, and therefore no updates even if a full second passes). But it’s sufficient for demonstration purposes here.
🖐️ Why didn’t I just use throttle from swift-async-algorithms? I did, at first, and quickly discovered that its performance is horrible. While I do suspect I can ‘optimise’ it to not be atrocious, I haven’t pursued that as it was easier to just write my own throttling system.
The above seems fairly straightforward, but if you run it and have any non-trivial I/O rate – even just a few hundred kilobytes per second – you’ll find that it saturates an entire CPU core, not just wasting CPU time but limiting the I/O rate severely.
Using a SuspendingClock makes no difference.
In a nutshell, the problem is that Swift’s Clock protocol has significant overheads by design1. If you look at a time profile of code like this, you’ll see things like:
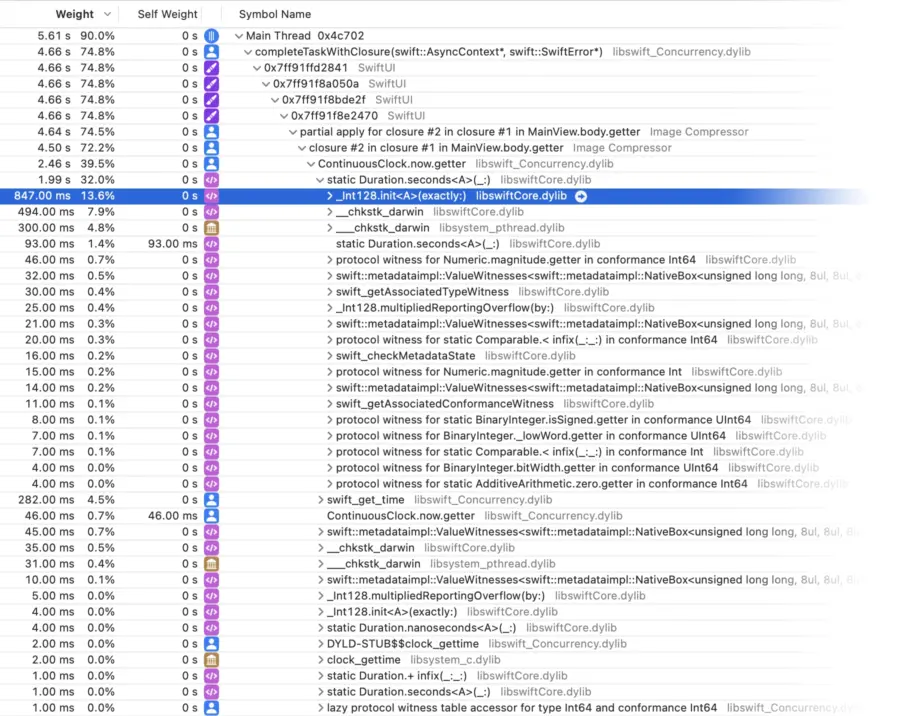
That’s a lot of time wasted in function calls and struct initialisation and type conversion and protocol witnesses and all that guff. The only part that’s actually retrieving the time is the swift_get_time call (which is just a wrapper over clock_gettime, which is just a wrapper over clock_gettime_nsec_np(CLOCK_UPTIME_RAW), which is just a wrapper over mach_absolute_time).
I wrote some simple benchmarks of various alternative time-tracking methods, with these results with Swift 5.10 (showing the median runtime of the benchmark, which is a million iterations of checking the time):
| Method | 10-core iMac Pro | M2 MacBook Air |
|---|---|---|
ContinuousClock | 429 ms | 258 ms |
SuspendingClock | 430 ms | 247 ms |
Date | 30 ms | 19 ms |
clock_gettime_nsec_np(CLOCK_MONOTONIC_RAW) | 32 ms | 10 ms |
clock_gettime_nsec_np(CLOCK_UPTIME_RAW) | 27 ms | 10 ms |
gettimeofday | 24 ms | 12 ms |
mach_absolute_time | 15 ms | 6 ms |
All these alternative methods are well over an order of magnitude faster than Swift’s native clock APIs, showing just how dreadfully inefficient the Swift Clock API is.
mach_absolute_time for the win
Unsurprisingly, mach_absolute_time is the fastest. It is what all these other APIs are actually based on; it is the lowest level of the time stack.
The downside to calling mach_absolute_time directly, though, is that it’s on Apple’s “naughty” list – apparently it’s been abused for device fingerprinting, so Apple require you to beg for special permission if you want to use it (even though it’s used by all these other APIs anyway, as the basis for their implementations, and there’s nothing you can get from mach_absolute_time that you can’t get from them too 🤨).
Date surprisingly not bad
I was quite surprised to see good ol’ Date performing competitively with the traditional C-level APIs, at least on x86-64. Even on arm64 it’s not bad, at still a third to half the speed of the C APIs. This surprised me because it has the overhead of at least one Objective-C message send (for timeIntervalSinceNow), unless somehow the Swift compiler is optimising that into a static function call, or inlining it entirely…?
Update: I later looked at the disassembly, and found no message sends, only a plain function call to Foundation.Date.timeIntervalSinceNow.getter (which is only 40 instructions, on arm64, over clock_gettime and __stack_chk_fail – and the former is hundreds of instructions, so it’s adding relatively little overhead to the C API).
This isn’t being done by the compiler, it’s because that’s actually how it’s implemented in Foundation. I keep forgetting that Foundation from Swift is no longer just the old Objective-C Foundation, but rather mostly the new Foundation that’s written in native Swift. So these performance results likely don’t apply once you go back far enough in Apple OS releases (to when Swift really was calling into the Objective-C code for NSDate) – but it’s safe to rely on good Date performance now and in future.
I certainly wouldn’t be afraid to use Date broadly, going down to lower APIs only when truly necessary – which is pretty rarely, I’d wager; we’re talking a mere 19 to 30 nanoseconds to get the time elapsed since a reference date and compare it to a threshold. If that’s too slow, it might be an indication that there’s a bigger problem (like transferring data a single byte at a time, as in the example that started this post – but more on that in the next post).
Follow-up
This post got some attention on HackerNews. Pleasingly, the comments there were almost all well-intentioned and interesting. It’s a bit beyond me to try to address all of them, but a few in particular raised good points that I would like to answer / clarify:
- A lot of folks were curious about
mach_absolute_timebeing on Apple’s naughty list. I don’t know for sure why it is either, but I think it’s very likely that it’s primarily because it essentially provides a reference time point, that’s very precise and pretty unique between computers. It’s not the boot time necessarily – because the timer pauses whenever the system is put to sleep – but even so it provides a simple way to nearly if not exactly identify an individual machine session (between boots & sleeps). It probably wouldn’t take many other fingerprinting data points to reliably pin-point a specific machine.
Secondarily, because it provides very precise timing capabilities (e.g. nanosecond-resolution on x86), it could possibly be a key component of timing attacks and broader device fingerprinting based on timing information (e.g. measuring how long it takes to perform an otherwise innocuous operation).
That all said, the only difference between it and some of the higher-level APIs wrapping it is their overhead. And it’s not apparent to me that merely making the “get-time” functionality 2x slower is going to magically mitigate all the above concerns, especially when we’re still talking just a few nanoseconds. - Admittedly my phrasing regarding Apple’s policies on
mach_absolute_time– “beg for permission to use it” – is a little melodramatic. It’s revealing something of my personal opinions on certain Apple “security” practices. I love that Apple genuinely care about protecting everyone’s privacy, but sometimes I chaff at what feels like capricious or impractical specific policies.
In this particular case, it’s not apparent to me why this sort of protection is needed for native apps. In a web browser, sure, you’re running untrustworthy, essentially arbitrary code from all over the place, a lot of which is openly malicious (thanks, Google & Facebook, for your pervasive trackers – fuck you too). But a native app – or heck, even a dodgy non-native one like an Electron app – must be explicitly installed by the end user, among other barriers like code signing. - A few folks looked at the example case, of iterating a single byte at a time, and were suspicious of how performant that could possibly be anyway. This is a very fair reaction – it’s my ingrained instinct as well, from years of C/C++/Objective-C – but it’s relying on a few outdated assumptions. My next post already covered this for the most part, but in short here:
Through inlining, that code basically optimises down to an outer loop that fetches a new chunk of data (a pointer & length) plus an inner loop to iterate over that as direct memory access. The chunks are typically tens of kilobytes to megabytes, in my experience (depending on the source, e.g. network vs local storage, and the buffer sizes chosen by Apple’s framework code). So it actually is quite performant and essentially what you’d conventionally write in a file descriptor read loop. If and when it happens to optimise correctly. That’s the major caveat – sometimes the Swift compiler fails to properly optimise code like this, and then indeed the performance can really suck. But for simple cases like in this post’s example code, the optimiser has no trouble with it. - Similarly, a few folks questioned the need to check the clock on every byte, as in the example. That’s a valid critique of this sort of code in many contexts, and I concur that where possible one should try to be smarter about such things – i.e. use sequences of bunches of bytes, not sequences of individual bytes. e.g. with
URLSessionyou can, and indeed it is faster to do it smarter like that. But, you can get acceptable real-world performance with this code, even in high-throughput cases, and it’s relatively simple and intuitive to write, so it’s not uncommon or necessarily unreasonable.
In addition, sometimes you’re at the mercy of the APIs available – e.g. sometimes you can only get anAsyncSequence<UInt8>. If you don’t care about complete accuracy, you can do things like only considering UI updates every N bytes. You’ll save CPU time and nobody will notice the difference for small enough N on a fast enough iteration, but if those prerequisites aren’t met you might read e.g. N-1 bytes and then hit a long pause, during which time you have the extra N-1 bytes in hand but you’re not showing as such in your UI. - Some folks noted that are a lot of other clock APIs from Apple’s frameworks, like
DispatchTimeandCACurrentMediaTime. I didn’t include those in the benchmark because I just didn’t think of them at the time. If anyone wants to send me a pull request adding them to the code, I’d be very happy to accept it.
I haven’t checked all those other APIs specifically, but I can pretty much guarantee they’re all built onmach_absolute_timetoo (possibly via one or more of the other C APIs already covered in this post). In fact those two examples just mentioned are explicitly documented as usingmach_absolute_time. - Kallikrates quietly pointed to a very interesting recent change in Apple’s Swift standard library code, Make static [milli/micro/nano]seconds members on Duration inlinable. It’s paired with another patch that together seem very specifically aimed at eliminating some of the absurd overhead in Swift’s
ContinuousClock&SuspendingClockimplementations. The timing is a bit interesting – I don’t know if they were prompted by this post, but it’d be an unlikely coincidence otherwise.
In any case, I suspect it is possible to eliminate the overheads – there’s no apparent reason why they can’t be at least as efficient asDatealready is – and so I hope that is what’s happening. Hopefully I’ll be able to re-run these benchmarks in a few months, with Swift 6, and see the performance gap eliminated. 🤞
- One might quibble with the “by design” assertion. What I mean is that because it uses a protocol it’s susceptible to significant overheads – as is seen in these benchmarks – and because its internal implementation (a private
_Int128type, inside the standard library) is kept hidden, it limits the compiler’s ability to inline, which is in turn critical to eliminating what’s technically a lot of boilerplate. In contrast, if it were simply a struct using only public types internally, it would have avoided most of these overheads and been more amenable to inlining.
It’s not an irredeemable design (I think) – and that’s what the recent patches seem to be banking on, by tweaking the design in order to allow inlining and thus hopefully eliminate almost all the overhead. ↩︎


Developers tend to dramatically overestimate the performance impact of message sending. Particularly Swift tends to do things that are around an order of magnitude slower.
True, although with the performance seen here a message send would seems suspiciously fast, if it were happening.
And indeed, now that I look at the disassembly, there are no message sends – it’s basically a direct function call. I’ll update the post with some details.
I just tried on my M1, and get the same 6ms for mach_absolute_time() you got on the M2 and also get 19ms for Objective-C. +[NSDate timeIntervalSinceReferenceData]
A message-send should be around 50% slower than a function call, the overhead is just the layers of stuff it’s calling.
+ 1276 +[NSDate timeIntervalSinceReferenceDate] (in CoreFoundation) + 48 [0x194999888]
+ ! 1235 clock_gettime (in libsystem_c.dylib) + 148 [0x19475b300]
+ ! : 1198 gettimeofday (in libsystem_c.dylib) + 56 [0x194753c9c]
+ ! : | 1147 __commpage_gettimeofday_internal (in libsystem_kernel.dylib) + 44 [0x1948780d8]
+ ! : | + 1147 mach_absolute_time (in libsystem_kernel.dylib) + 108,112,… [0x1948766c0,0x1948766c4,…]
+ ! : | 31 __commpage_gettimeofday_internal (in libsystem_kernel.dylib) + 80,72,… [0x1948780fc,0x1948780f4,…]
+ ! : | 16 __commpage_gettimeofday (in libsystem_kernel.dylib) + 0 [0x1948780a4]
+ ! : | 4 DYLD-STUB$$__commpage_gettimeofday (in libsystem_c.dylib) + 12 [0x1947c42dc]
+ ! : 35 gettimeofday (in libsystem_c.dylib) + 56,0,… [0x194753c9c,0x194753c64,…]
On second thought, while there are layers being called, the bulk seems to be in mach_absolute_time(), with very little being dissipated in the layers. Odd.
objc_msgSenduses a cache, so what you’re seeing in a tight loop is best-case behaviour where it’s always hitting the cache (and IIRC the cache specially prioritises repeated calls to the same method, so it’s maybe not even a hash table lookup, just a direct comparison with the last called method).But I think your point is valid more broadly –
objc_msgSendis on average faster than most people are led to believe (if they’re familiar with Objective-C). And when it’s not fast enough, IMP caching is easy to do. But, I think a lot of Swift’s benefits aren’t actually message calls vs function calls, but inlining. That’s where you can see some truly astounding performance optimisations (if the compiler plays along).It bears repeating that I thought I was benchmarking some Objective-C with the
Datecase, until I realisedDateis not the same asNSDatain Swift (and hasn’t been for ages – mea culpa). So there’s not actually any Objective-C coverage in these benchmarks (which is fine – that wasn’t my objective anyway – though if there were a reasonable way to add genuine Objective-C to the benchmark package I would do that).Well, the interesting thing is that I got exactly the same numbers for actual ObjC NSDate that you got for the Date that you only thought was ObjC. And our mach_absolute_time() numbers match exactly. So the overhead of NSDate vs. Swift Date appears to be exactly zero.
And yes, there’s caching, but no, it definitely is not a PIC (Polymorphic Inline Cache) and last I checked they did primarily some sort class-based caches, so performance is pretty consistent.
In general, Swift performance benefits tend to be theoretical, whereas in reality there tend to be massive performance issues, just like the one you show here. JSON coding is very similar, with the super, compiler-optimized SwiftCoding performing worse than a ludicrously badly coded Objective-C variant based on Key Value Coding. And I just saw a post where Swift’s async channels are apparently consistently more than an order of magnitude slower than Go channels.
If you mean Brian Floersch‘s Async-Channels package, check out the discussion about and optimisation of it.
In short, the problems there are largely similar to the ones here with the clocks: Generics-using code not being specialised and inlined correctly. I was able to show – details in the aforementioned Swift Forums thread – that if the compiler were to properly specialise Brian’s channels code then the performance actually is competitive with Go. Unfortunately no one has been able to figure out how to actually make it do that (short of copy-pasting the code into every module that uses it). 😕
Swift has the unusual ability, amongst languages with Generics, of ABI compatible implementations where the types used in the generics aren’t known at compile time (and “generics” here encompasses protocols, too). That’s super powerful – it’s what lets you use generics freely in dynamic libraries (from a functional sense, at least) and lets you use generics without forcing you to expose all your source code. It’s worth noting that those are pretty cool benefits.
But, alas, there is a potential downside, which is unexpected performance problems (and perhaps more critically, highly variable performance depending on subtle contextual factors like whether you’re crossing a module boundary, and how the compiler is feeling right at that nanosecond).
Yes, that was the discussion, but what I meant was Apple’s own implementation, which is significantly slower than Brian’s.
Highly variable, unexpected, and difficult-to-influence performance problems are pretty much Swift’s middle name. As a long time performance engineer, my take has always been that Swift’s approach is pretty much precisely the opposite of what you need to get good performance, never mind excellent performance. So far, the results in the field seem to bear that out.
I don’t think an order in magnitude is the qualification term here, I would say that a speed improvement between 1.5 and 3x is definitely non-trivial, but also definitely not “well over an order of magnitude”. Although it can be context-dependent, one order of magnitude is usually understood as a 10x difference.
See https://en.wikipedia.org/wiki/Order_of_magnitude
ContinuousClock/SuspendingClockare 13x slower (M2) and 14x slower (iMac Pro) than the next best option – and 41x slower (M2) and 28x slower (iMac Pro) than the fastest option. So, very clearly and literally an order of magnitude slower.You said “we’re talking a mere 19 to 30 nanoseconds” but in the chart it says 19 and 30 milliseconds. Are you talking about something different or should one of the units be the other?
Sorry for the confusion – the table is showing the time for a million iterations. So divide by a million to get the time for an individual operation (i.e. replace milliseconds with nanoseconds).
And just to elaborate, I chose to express the benchmark results this way (and am going to leave them this way) because it’s technically the more accurate statement. There’s slightly more to the benchmarks than just the call to get the time value – there’s also a delta calculation and a comparison of the result, with a conditional branch. So technically it’s inaccurate to say an individual call costs e.g. 19 to 30 nanoseconds – it’s potentially less, once you remove those other operations.
But, it’s also not necessarily less, because CPUs have very complicated optimisations like being superscalar and other forms of parallelism. So it’s going to vary a bit depending on how it’s actually used, anyway. Numbers like “19 to 30 nanoseconds” need to be taken with an implied fuzziness, to account for this.